"How can I create a strategy from this chart in ORCL?"
By Dave Mabe
DazeTrader asks a good question on X.
DazeTrader:
Can Trade-Ideas scan for intraday consolidation patterns? For example, $ORCL on 2/2 when the price was consolidating just above $168, then it broke down fast.
Dave:
It always seems like you can create a strategy by looking at a stock chart, but it's much harder than it seems.
Here's the chart:
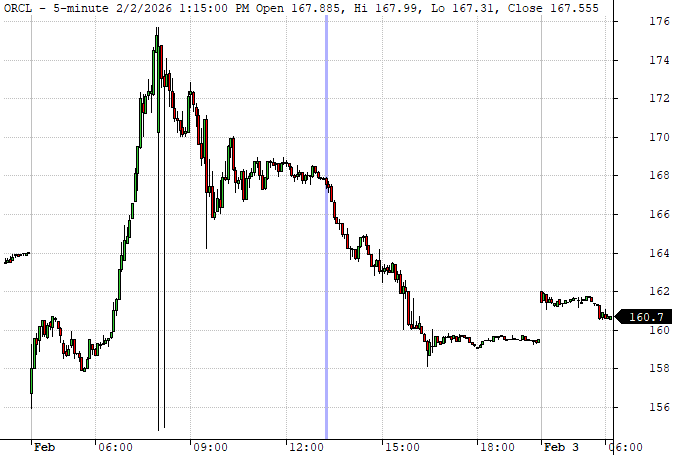
The purple line is the breakdown that occurred at 1:15pm ET or so.
This is a great situation to use the Stocks Like This tool, which is free to use without a Trade-Ideas subscription.
Here are my thoughts on a strategy for this move:
Most traders try to use a signal before the move, but you'll likely end up with a lot of noise in your backtest
Try using a signal after the move has started
A signal alone will yield too many trades, so the filters you use to define your universe are critical
Potential filters here to define your universe for a backtest:
The open is in the high end of the premarket range
Several green bars in a row in the premarket (how many ATRs is that move?)
After the open, the range consolidates for hours, all the way up to the 1:15pm move
Opening range > range of last hour > range of last few minutes
Maybe the 1:15pm move is a red herring - what if you shorted the big move up in the premarket?
Here's a video I put together with some more thoughts on this:
-Dave
P.S. This is a perfect situation to use the AFL code generator in MabeKit to create a strategy without writing a single line of code.
Here's what one trader says about it:
"The process of becoming a more systematic trader honestly mirrors the journey of becoming a trader at all—lots of ups and downs, frustration, second-guessing, and moments where you want to quit. And then every once in a while, there’s a real moment of clarity and forward progress. Using the AFL code generator in MabeKit feels like one of those moments." - Mike A.