Amibroker Performance
By Dave Mabe
One thing that new Amibroker users are surprised by is the resources the program consumes when you run a backtest.
Because it runs locally on your computer, when you scan the entire market, it can take a while.
And when you run a backtest with all the MabeKit columns in the library, there are even more resources used.
This progress bar will be very familiar to Amibroker users:
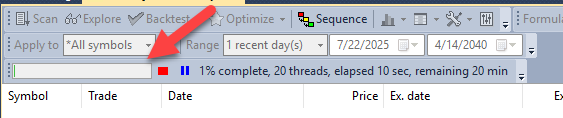
When the progress bar gets to 100%, Amibroker appears to lock up and become unresponsive.
But it's working fine.
The issue is that the final phase of the backtest (where all the MabeKit column data is added) is necessarily single-threaded, while the first phase is multi-threaded (see the 20 threads string in the status in the image above).
I was re-running one of my main backtests this past weekend after creating a new backtesting database with the Massive/Polygon tool I created.
I created a resource monitor script to graph usage over time of the main Amibroker executable during the backtest.
Here's what it looked like when I ran the backtest across 10 years of 1-minute data (with a periodicity of 3 minute for this particular strategy):
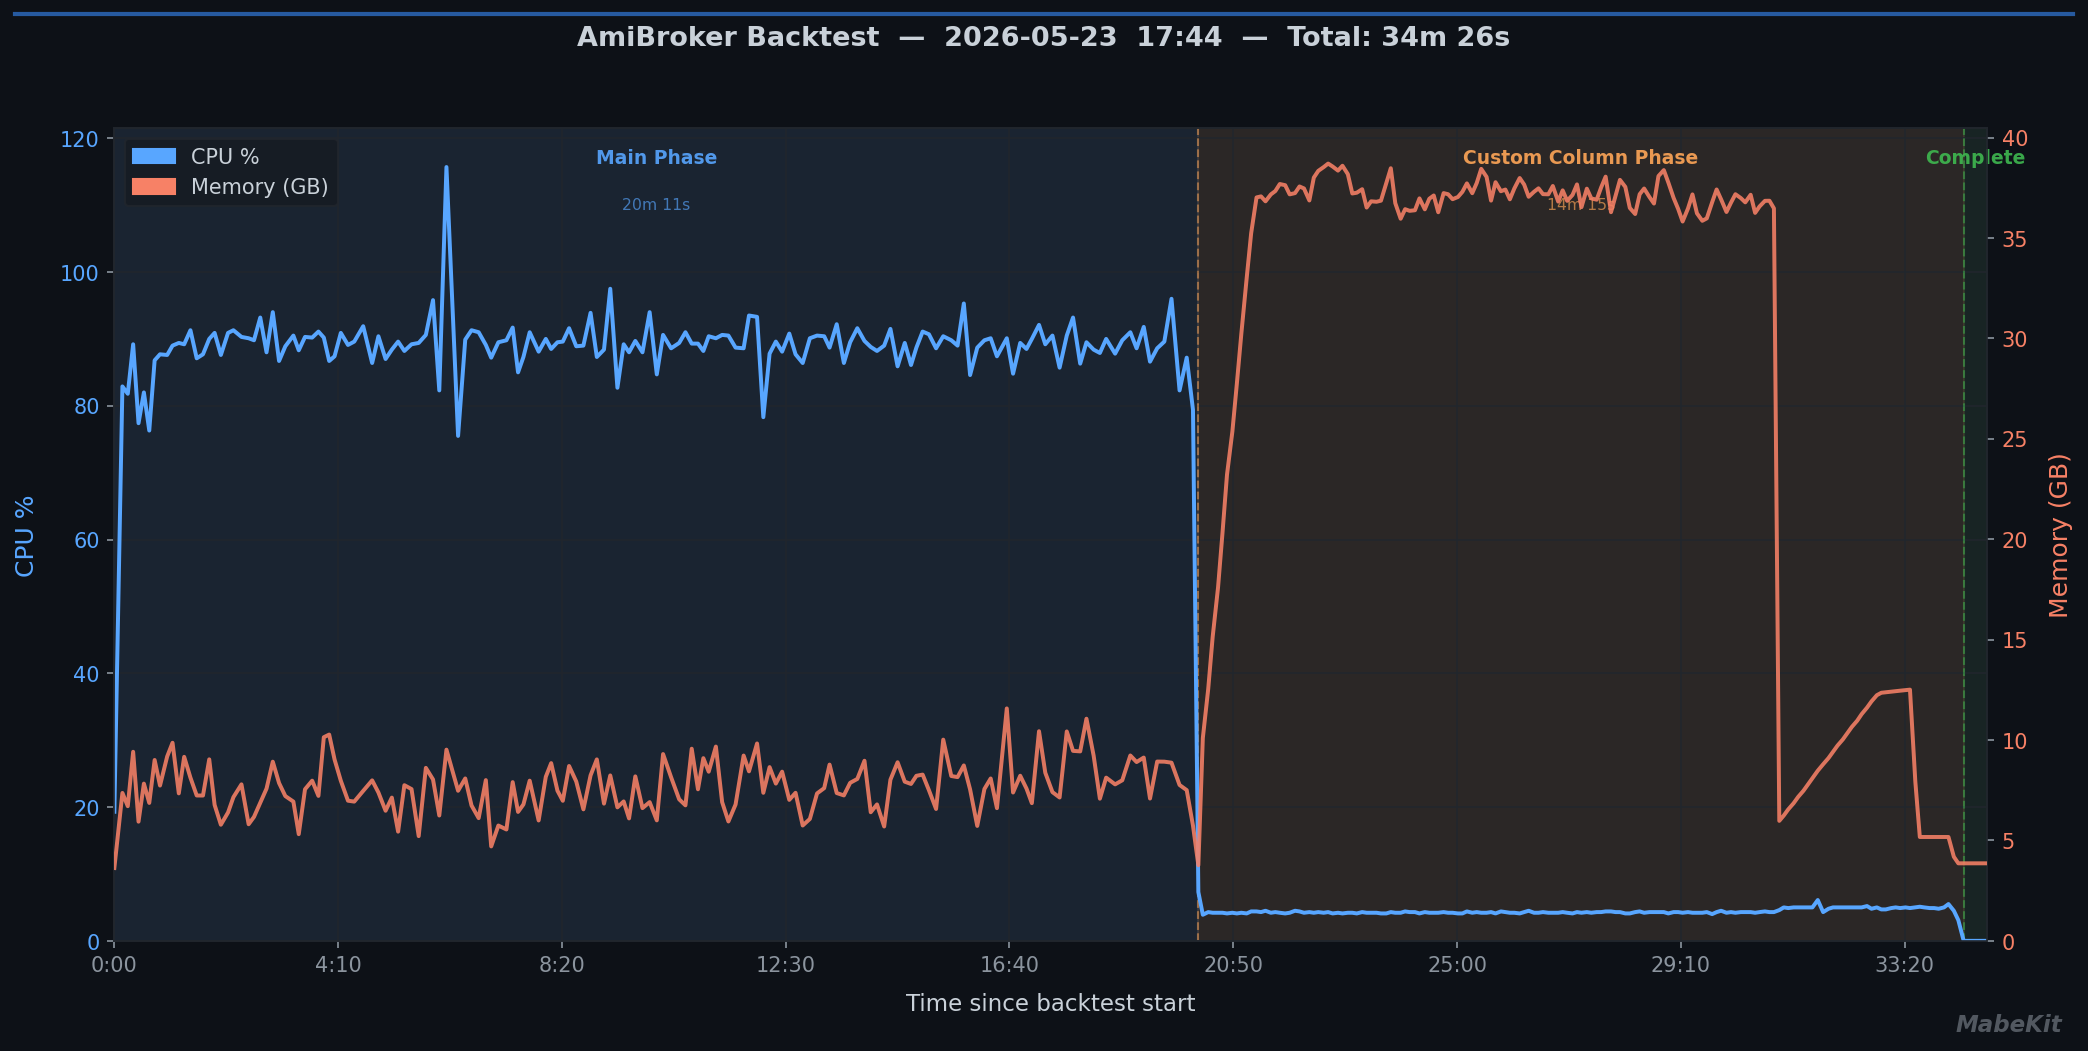
The chart allows you to clearly see the two phases of the backtest and what's going on.
The Main Phase on the chart is the first part that's multi-threaded.
The Custom Column Phase on the chart is the final, single-threaded part.
Very different resource profiles!
-Dave
P.S. Wish you could backtest your ideas - without spending months learning to code? Get the strategy included in the Amibroker AFL Course.