This is the fourth in a series of articles summarizing the monthly trading strategy article in the Technical Analysis of Stocks and Commodities monthly magazine.
System Type: Candle stick patterns
Author of article: Sylvain Vervoort, author of Capturing Profit with Technical Analysis

The Four Bar Candle Pattern That’s Supposed to Indicate Reversals
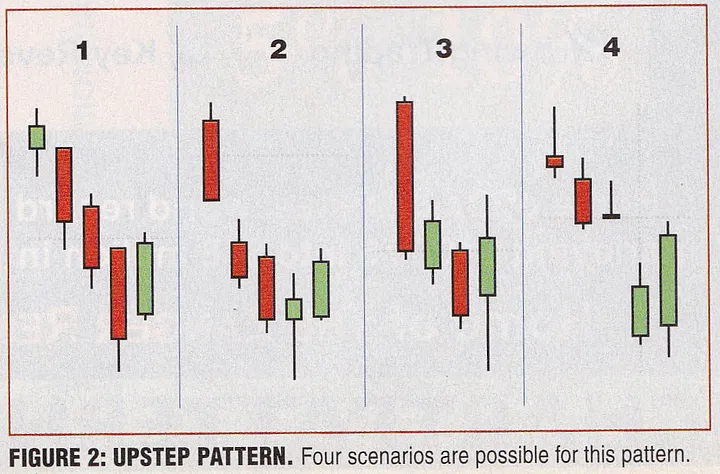
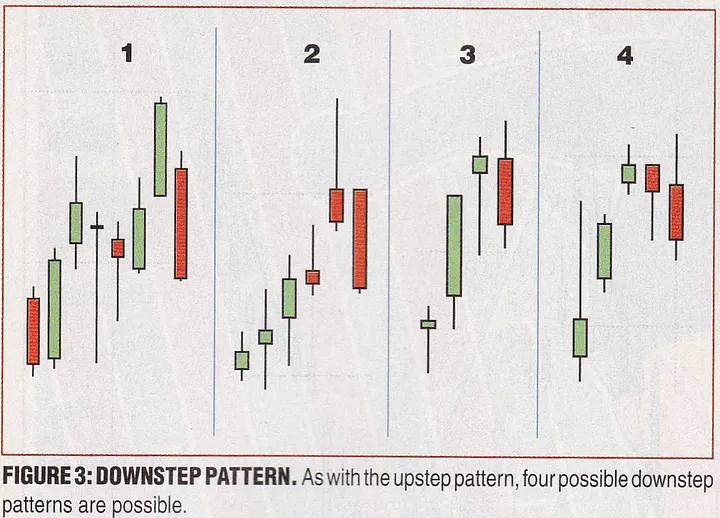
Sylvain makes an argument for a particular candle pattern that shows up in four different ways. There are two sets of patterns — one for uptrends that are reversing (the “downstep”) and one for downtrends that are reversing (the “upstep”).


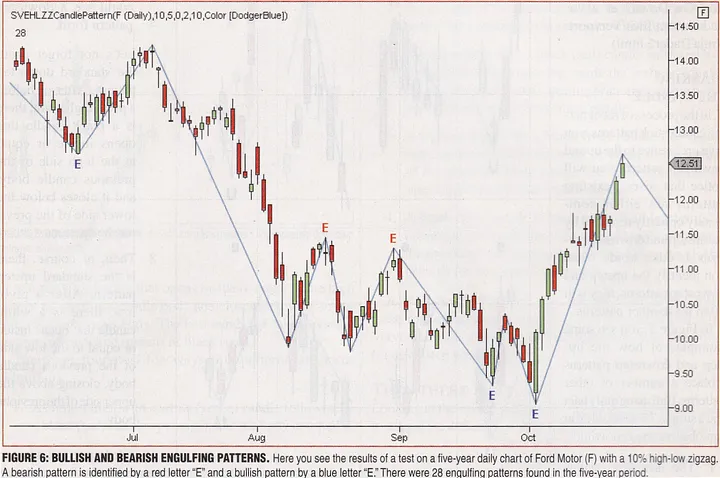
As in almost all articles of this kind there are some well chosen charts that show how perfect the candle pattern can be.

Usually Two Responses, Both Wrong
At this point there are usually two responses to these types of candle patterns. Some traders will look at the well chosen example chart and, despite a little skepticism, will do some further study looking for the particular pattern and build a trading strategy around it. Another group of traders with a little more experience will look at this pattern and dismiss the idea entirely. They used to be the first type of trader but feel like they’ve been around the block and that candle patterns and simply voodoo and will quickly dismiss them.
Both of these responses are the wrong way to think about candle patterns. They both are approaching the candle pattern as if the pattern itself is the trigger to build a trading system around.
A candle pattern alone is (almost?) never enough to use as a trading system. It has to be combined with several other filters and only when they are satisfied might the candle pattern have a statistical significance within a trading system. To use them as the primary trigger in a system is not likely to work out, but don’t dismiss them so soon.
A Better Approach
They way I like to think about candle patterns is to see if they appear in some of my already existing trading systems. Trading systems are usually either trend following or reversal systems. Because all systems are based on price action and candlesticks are just one way to reflect that price action, the trigger in your trading systems will necessarily be preceded by some candle patterns. It’s likely you can examine those preceding bars and put them into a finite set of categories of patterns.
You’ll probably find that some of those categories perform better than others. This often leads to more interesting questions:
- Can I increase trading size when a certain pattern appears in my system?
- Can I completely eliminate some losing trades by skipping some categories of trades within my system?
- Can I fundamentally alter my system in such a way to capture more trades within a certain profitable category?
These are all good, thought provoking questions that traders should always be asking. Remember — the bar is pretty low — lower than many people think. If you can find something that’s statistically significant within the random noise of the market that consistently improves your trades just slightly — that can be very valuable.
TODOS
There are two ways I could see exploring this particular step up/down pattern. One would be categorizing the previous patterns in a couple of my systems on an intraday level. Another might be to take a broader look at the daily charts on my intraday systems. That is, what daily patterns precede the day where a trigger occurs? Both of these are useful exercises for further exploration.