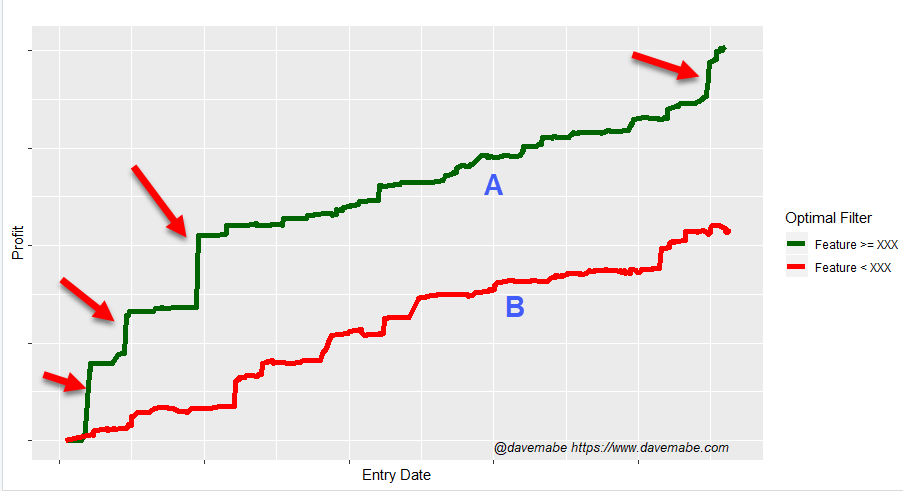
Last week I showed a chart with two equity curves A and B.
(Click on the link to view the full message.)
The two equity curves come from a strategy I’m working with a trader on.
The goal is to get more P&L from this already profitable strategy.
One way to do that is to remove poor trades using a rule.
Curve A represents trades in the system where the value for a certain indicator is above X while curve B represents trades where the value is below X.
Curve A looks so attractive at first glance compared to curve B, so it’s tempting to apply this rule to the system.
But I do not recommend this and I asked readers why.
Here are some responses I got.
Garrett Drinon of SMB Capital said, “Because they’re both good and we want more trades and hence more PNL.”
Romoi said, “Is it because there are only a few big wins separating the curves? Meaning it could be curve fitting and bringing anomalies?”
Yaping said, “Is it because it is not a steady trend that has a big swing at the beginning and the end of the curve? The middle curves are almost the same between both. For those big swing up, it likely to associate with big swing down some time down the road.”
Berker T. said, “I speculate that curve A seems to have some rules specific to trades that occurred on dates corresponding to jumps of the graph. The first 3 jumps are roughly 4 bars in height, and the graphs are roughly 3 bars apart, so probably without considering the first 3 jumps, curve a would be lower than curve b. We have only 3 instances of jumps, so they may be just luck as well. In the future, those jumps may not happen, or worse the jumps may be to the downside.”
All of these are great answers.
When I consider a rule to improve a trading strategy, the rule needs to identify a highly predictive split between good trades and bad trades.
When you look at the chart, notice that aside from a handful of days in curve A, both curves are basically the same. (See chart below)

If you took those 4 days out of curve A, curve B would end up even higher than curve A.
If you applied this rule to the strategy, you would be giving up a lot of P&L for no good reason!
Here’s the thing…
If you only look at the overall stats (total profit, win rate, profit factor, etc), curve A appears to be better in every way.
This is why it’s so important to look at equity curves to understand the full picture, otherwise these profitable details will slip right under your nose.